Gallery
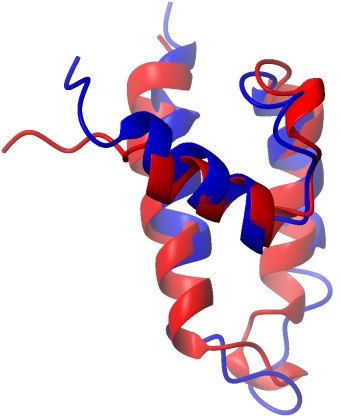
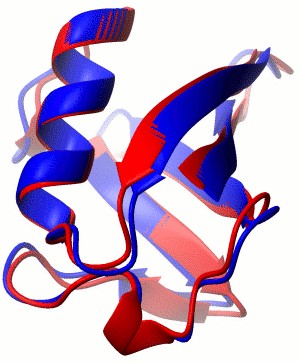
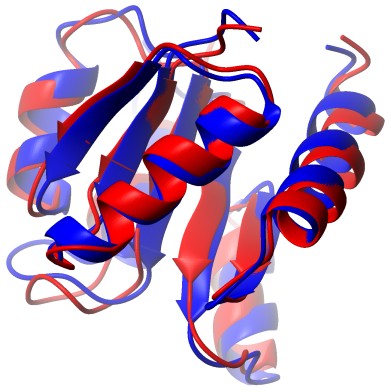
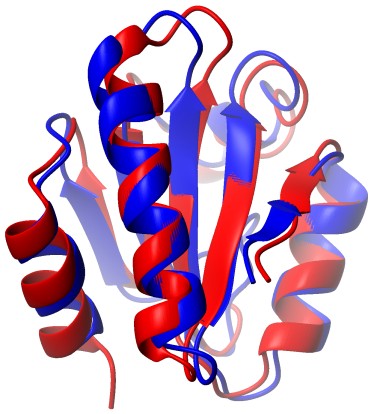
Below are a few examples that have been tested with CS23D2.0. With each example, you may use the Input file to submit against the server. Each corresponding row contains a GA Score and a Mean Chemical Shift Correlation, which illustrates the quality of the structure, and also a PDB Structure file, which is the final output of the program. The graphical 3D structure is provided below each row for convienence.
Warning : May take a few minutes for all the Images to load.
BMRB ID |
Protein Name |
Input |
GA Score After Minimization |
Mean Chemical Shift Correlation After Minimization |
CS23D2.0 Coordinate File |
BMR4403 |
Polyomavirus J domain |
|
-5.96 |
0.59 |
|
BMRB ID |
Protein Name |
Input |
GA Score After Minimization |
Mean Chemical Shift Correlation After Minimization |
CS23D2.0 Coordinate File |
BMR5387 |
Ubiquitin |
|
-12.18 |
0.69 |
|
BMRB ID |
Protein Name |
Input |
GA Score After Minimization |
Mean Chemical Shift Correlation After Minimization |
CS23D2.0 Coordinate File |
BMR4083 |
Chemotaxis Y |
|
6.56 |
0.06 |
|
BMRB ID |
Protein Name |
Input |
GA Score After Minimization |
Mean Chemical Shift Correlation After Minimization |
CS23D2.0 Coordinate File |
BMR5308 |
Human-E.coli Chimeric Thioredoxin |
|
-9.23 |
0.62 |
|
BMRB ID |
Protein Name |
Input |
GA Score After Minimization |
Mean Chemical Shift Correlation After Minimization |
CS23D2.0 Coordinate File |
BMR4076 |
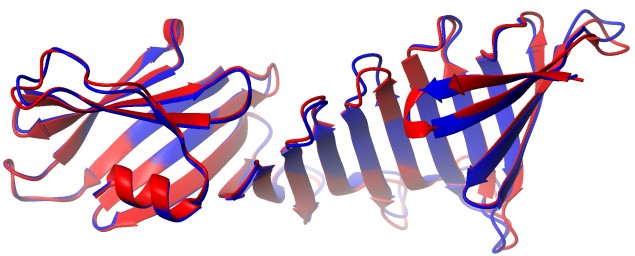
Outer Surface Protein A from Borrelia burgdorferi |
|
67.21 |
0.16 |
|
|


